In short: If a page on your site looks broken, a form does nothing or an image will not load, the reason is often spelled out in your browser's developer tools. In Chrome and Edge, press F12: the Console tab shows error messages and the Network tab shows the status code and timing of every request. This guide walks you through both tabs step by step and shows how to share what you find with support safely.
Open the problem page in Chrome or Edge and do one of the following:
F12.Ctrl + Shift + I on Windows/Linux or Cmd + Option + I on macOS.When the panel opens you will see tabs such as Elements, Console and Network. The same shortcuts open a similar panel in Firefox.
Switch to the Console tab and reload the page. Red lines are errors and yellow lines are warnings. Common messages and what they mean:
| Text in the message | What it means |
|---|---|
Failed to load resource ... 404 |
A file the page requests does not exist on the server or its path is wrong. |
Mixed Content |
An HTTPS page loads a resource over http://. See our mixed content error article for the fix. |
Uncaught TypeError / ReferenceError |
There is an error in a JavaScript file, usually from a plugin or theme script. |
blocked by CORS policy |
The page is trying to access a resource on another domain and that server does not allow it. |
Click the file name on the right of a line to see which file the error comes from. If the path contains something like /wp-content/plugins/plugin-name/, the problem is most likely in that plugin. For a full reference, see the Chrome Console documentation.
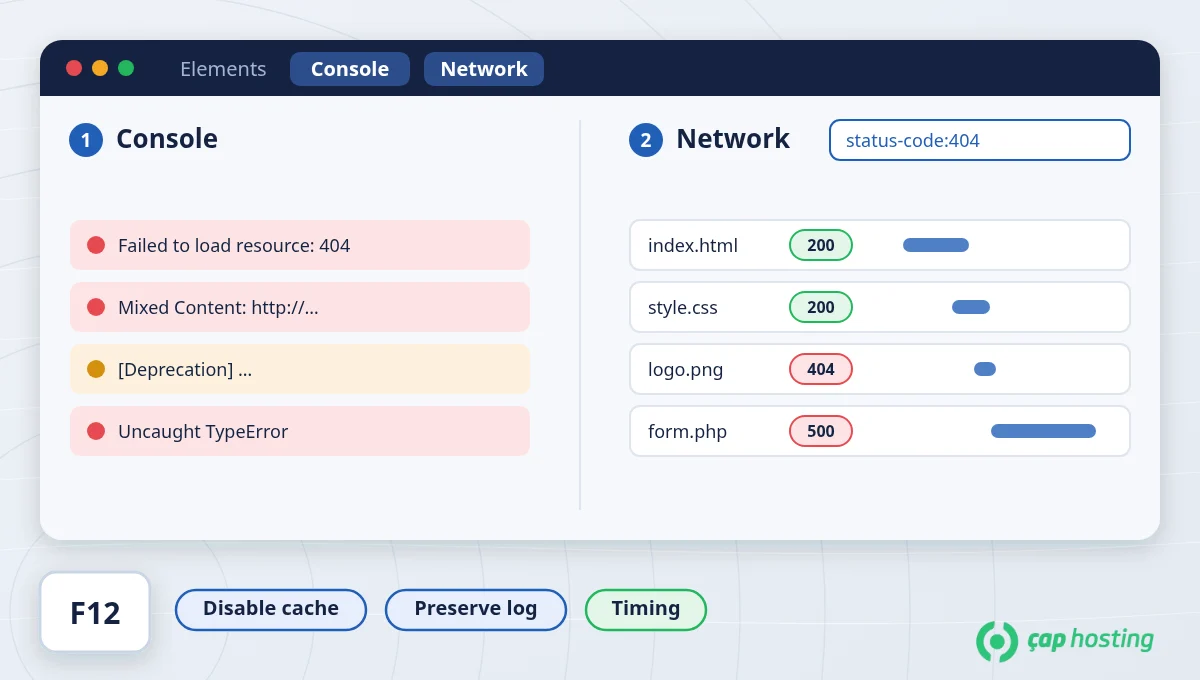
The Status column shows the HTTP status code of each request. To see only failed requests, type status-code:404 or status-code:500 in the filter box at the top. The filter buttons (Doc, CSS, JS, Img, Fetch/XHR) list only certain types. See HTTP status codes explained for what each code means.
Click a row in the list to open its details on the right:
All Network panel features are described in the Chrome Network documentation.
If you cannot solve the problem yourself, the following information speeds up support considerably:
Be careful if you export the network log as a HAR file: by default Chrome produces a "sanitized" log without cookie and authorization headers, but the file can still contain the URLs you visited and form data. For the same reason, remove cookie lines from Copy as cURL output before sharing it. You can send the details by opening a support ticket.
Ctrl + Shift + M (Cmd + Shift + M on macOS).No. Changes in the Elements tab apply only in your own browser while that page is open and disappear when you reload. Files on the server are not touched.
Most warnings are about deprecated features or third-party scripts and do not break the site. Focus on the red error lines first.
The panel only records requests made while it is open. Reload the page after opening the tab.
Ask that user for a Console screenshot from the same page. Browser extensions, an old cache or a different network (such as a company proxy) can cause such differences.
 Copyright © 2026 All Rights Reserved

 Turkey (Türkçe)
 Worldwide (English)